About this image
This image is inspired by the paper by Ulrich Reitebuch, Henriette-Sophie Lipschuetz, Konrad Polthier, and Martin Skrodzki , given at the Bridges 2024 conference.
The complex function
The picture corresponds to a colouring of the complex plane according to a function f(z) = a0(z-a1)(z-a2)(z-a3)(z-a4)/(z-a5)(z-a6)(z-a7)(z-a8) where a0 to a8 are complex numbers.
That is, this is a picture determined by a complex function which is the ratio of two polynomials. The zeros are a1 to a4, and the poles are a5 to a8.
The values of a0 to a8 are determined by the moveable dots.
They can also be changed using the input buttons below.
Zeros: The dots with a vertical line
correspond to a1 to a4.
Poles:
The dots with a central black spot correspond to a5 to a8.
Constant multiplier: The green dot controls a0.
The colouring
As well as the complex function f(z), a function G(w) from two variables to 3 variables, is used to colour the image. The colour of a point on the screen is determined by the 3 values of the red, green, blue components of the colour. This is a function G(w), where w is a complex number w=u+iv. For a point (x,y) on the screen, we let z=x+iy, let w=f(z), and colour with G(f(z)).
The colouring function G(w) of the image is determined by the choice of style by the slider. Note that some parameters of a couple of styles are controled by the a1 and a2 dots. In other cases, sliders determine aspects of the colouring function. The styles correspond to either a polar coordinate shading, or an (x,y) dependent shading, or just the axis, or some other variation of these.
When the dots are in the gray strip on the left, they are not used in the definition of f(z), and instead the corresponding factor is replaced by 1. If all dots are in the gray strip (except possibly the a0 dot), the function is constant, so screen is all one colour.
On loading the program, the screen shows the function f(z)=z, with a polar coordinate type colouring. We have a1 = 0, and all other points are in the black strip, so give a factor 1 in f(z), i.e., have no effect.
Notes on colourings
Many of the images are coloured according to either the value of
u and v, or the length of w, or the angle of w in the argand diagram (complex plane).
Here w is a complex number, and w=u + iv.
Colouring style 0 is such that points are coloured in rings depending on
how far |w| is from an integer, and radial lines depending on theta/(2pi) mod 1/12,
where the angle theta is given by the angle of w to the u axis, i.e.,
w= |w| exp(i theta).
The problem with this colouring is that for z close to a pole, e.g., a5, w will be
close to infinity, and there will be many concentric rings very close together, which
will not display properly, since the program will only resolve colours at discrete
distances from each other, not at points arbitrarily close to each other.
This gives some weird moire type effects.
We can see this is an effect of the rendering, not an effect of viewing this by using
the rotation slider. This should only rotate the image, and shouldn't change it otherwise, but we can see the rotation changes the effect.
Styles 24 and 25 with the grid of dots also have this problem.
One way to avoid too many rings when w is very large is to work with the minimal value of
|w| and |1/w| instead of just with |w|. This is done in styles 17 to 23.
The same issue occurs for working with a colour based on how close u and v are to integers (actually half integers), as in colouring 1. Again, one way to resolve this is to work with the minimal value of the real and imaginary parts of w and 1/w, which is done in style 12. Here there is an abrupt change in style when these values are equal, at |w|=1. This effect is less
obvious for the polar coordinate rendering style.
Style 6 gives a colour depending on which quadrant of the complex plane w is in.
There is no smoothing at the boundaries in style 6. Versions with smoothing are given by styles
8 and 9, and 26.
Further controls of image
Below the image you can use controls to change various parameters.
Rotate: change the angle that the image is shown at; the point of this is to show problems with image near poles. This does not change the values of a0 to a8, but changes where these points are represented on the screen.
Parameters for colours in some of the images. For some styles these won't make any difference.
Some preset choices of parameters. You can start from one of these and alter the
parameters or move the zeros and poles.
Layout; on some screens it may work out better to have different layout.
Size of dots used to determine values a0 to a8. This can make the dots vanish, for a better image, or make them larger and easier to see to move about.
If a preset option makes dots vanish use this slider to make them visible if you want to move them around.
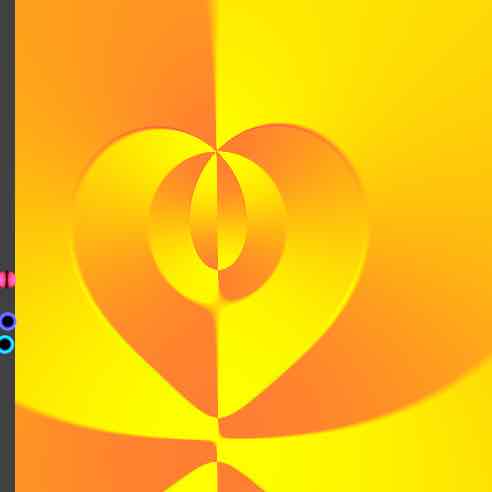
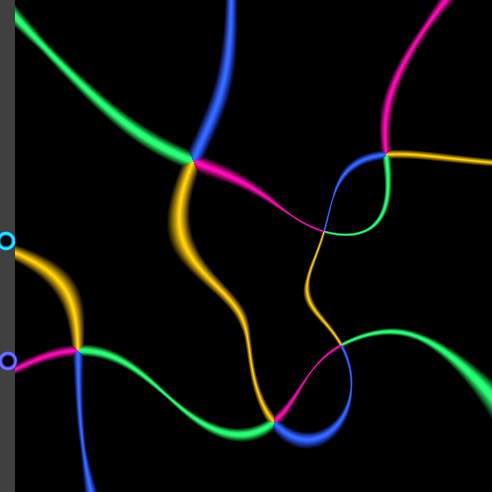
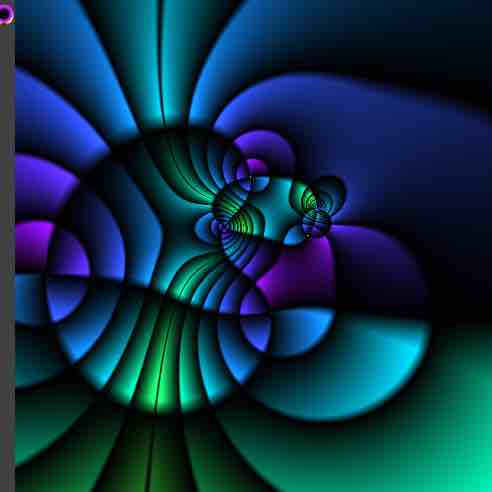
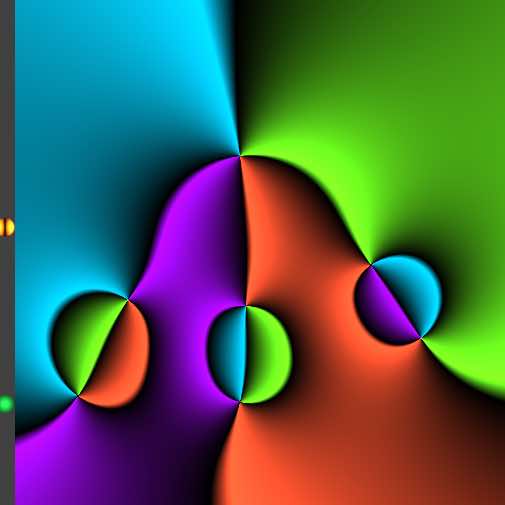
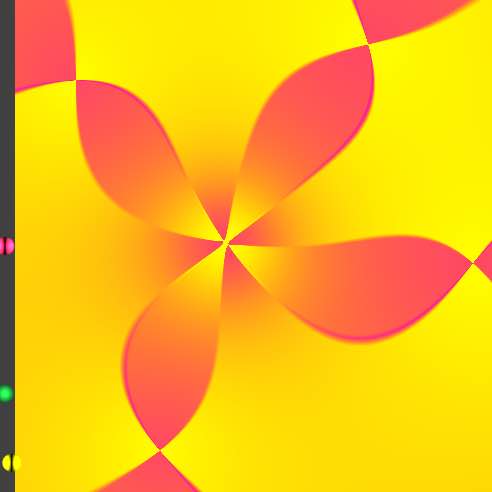
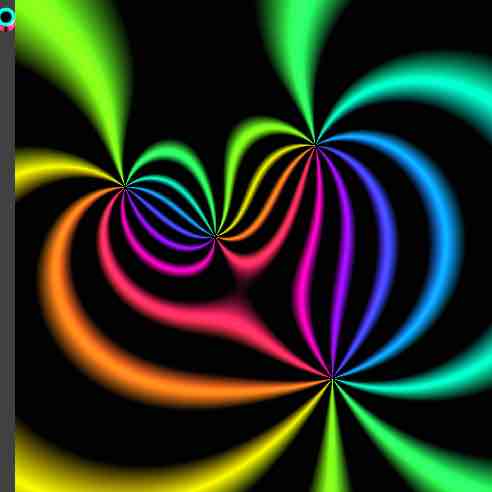
Examples
The following images, obtained from the program on this page,
are reduced size for easier download; higher quality images
can be obtained from the program.
Click on the png button to download a png version of a picture on the screen.
The following have been converted to jpg and reduced. The original quality will depend on the size of the screen that the picture is initially rendered on via the javascript/Webgl. Also the program does not seem to work well on mobile devices; the images will probably be better on a computer or laptop. This was tested on Safari on a macbook.
Current values of parameters
Real and imaginary parts of the complex numbers corresponding to a0 to a8