Chomp is a game for two players, described on
this Wikpedia page.
You can play 4 row chomp
on a page of Thomas S. Ferguson,
here.
Here is a picture of a position in 3 row chomp.
My notation (i,j,k) corresponds to
the rows in chomp having lengths i+j+k, j+k, k.
The following picture corresponds to a chosen point in the plane
in the grid that follows.
If i,j or k are large, you may need to change scale:
Move the mouse over a grid square below
to display the corresponding chomp position above. A blue dot on the grid
indicates a winning position for second player. You can not play the
game on this page, it's just to show you what the winning moves are. A yellow
dot on a blue circle means this is the winning move you need to make from the
given position. If a purple dot with yellow circle appears, this means that is
the winning move i,j value,
but a smaller k value than the current k shown in the grid.
I put a picture with multiple k sheets here (3x20)
and here (3x60), but it is harder to see what is going on than just looking at one value of k at a time.
Click on the advance buttons and so on to change k.
(i,j,k) = 0, 0, 0
change scale:
About
The above picture
shows a plane of (i,j,k) positions for the game of three row
chomp,
for fixed k.
To change k, use the advance and back buttons.
When you use large k, small scale, and click on "superimpose",
the pictures will look similar to those in a
paper by Friedman and Landsberg.
Their results are also described in a
science news page on chomp.
Because my Javascript program is relatively slow,
I only run it for a maximum of k=300, corresponding to max i =215.
You can choose a new value here: max i=
and reload the page to run with your prefered max i. This might run very
slowly depending on your computer.
If you are using a device with a mouse, move over on the grid will show corresponding
chomp position and winning move if possible, which is a shaded subset
showing what you should leave.
Data displayed "computing info"
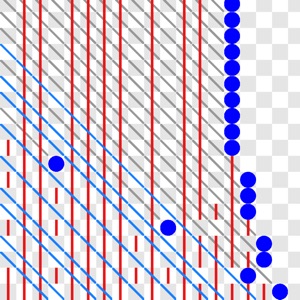
The positions which are winning for the second player (P positions)
are marked by blue circles.
The red vertical lines pass through values (i,j,k) which can not be P positions because
there is a P position of the form (i,j+l,k-l) for some l, which can be reached from this position.
These lines may not all show up properly at small scales with a small browser window.
The blue digonal lines pass through values (i,j,k) which can not be P positions because there is a
P position of the form (i+j+l,0,k-l) which can be reached from this position.
The gray diagonal lines pass through values (i,j,k) which can not be P positions because
there is a P position, marked on the graph by a blue dot, of the form (i+l,j-l,k), which can
be reached from this position.
Also any position to the right on the same row as a blue dot can't be a P position because
of the first blue dot that occurs, but I have not put lines through these squares, because my
algorithm is to just go straight to the next row (I start at the bottom row) to find the next P
position, since I know there are no more on a row after one P position is found, since you can
get from (i,j,k) to (i-l,j,k).
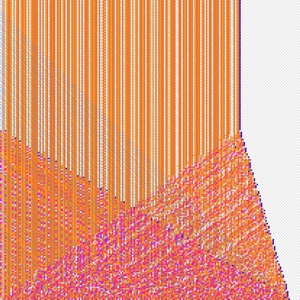
Superimpose
This option allows you to look at all layers below layer k, so a square (i,j) is coloured if there
is any l less than
k with (i,j,l) a second player win. The colours depend on how many l for which is this the case.
Only the current level (i,j,k) win positions are marked with the blue dots.
Second player win
This option only shows the second player win positions. This is the Looser sheet in
Friedman and Landsberg's paper.
First player win to lower level
This is the winner sheet in Friedman and Landsberg's paper.
This means marking all the squares which I have put a red or blue line through, but not the gray
lines. Also for this option I replace lines by squares. Lines are used to indicate the change of
position to next value of k. This version is to show replication of the
Friedman and Landsberg's pictures.
If you click on the normalize button, the image will be scaled to fit, so the
effect described by Friedman and Landsberg, of the pictures looking
pretty much the same when scaled, can be seen. You can see this if you click on normalize
then click through on the advance button to increase k.
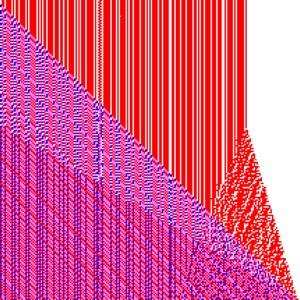
The last display option shows a coloured version of Friedman and Landsberg's graph.
This time red is used to indicate a win via moving from (i,j,k) to (i,j+&ell,k-&ell),
blue for a win via moving to (0,j+i+&ell,k-&ell),
and magenta where both options are possible (for some &ell, not necessarily the same one for the two
cases).
Pictures
In case you are not able or willing to run Javascript/Webgl on your browser, here are a couple of pictures to illustrate the
output. The first shows the result for k=22
so you can see the red, blue and gray lines mentioned. The background checkerboard is supposed to make it easier to
distinguish (i,j) positions.
The second shows the result when k=280, and all the previous levels superimposed and coloured according to number of times
(i,j,k) is a P position for some k. The third is a coloured version of Friedman and Landsberg's
winning sheet.
Algorithm
The algorithm to find the positions in the above picture is as follows:
Starting position is k=0 and a column of blue dots with i=1
Transfer necessary k-1 and below data to k level:
put a red mark in the square below where any blue dot is for the k-1 level
put a red mark in the square below where any red mark is for the k-1 level
put a blue mark in the square to the immediate left of a blue dot in (i,0,k-1) position
put a blue mark in the square to the immediate left of a blue mark in (i,0,k-1) position
Any blue line in the bottom row now is extended diagonally to the left
Fill in k level:
Starting from the bottom row and working left to right, fill in a blue dot in the first place
where there is no blue, red or gray mark
When you fill in a blue dot, fill in all the diagonally to the left and above squares with grey
lines
After doing this, go to the next row and repeat
If you put a blue dot in the first column, then there are no more blue dots to add
How to play chomp - move types
To play 3 row chomp, from a position (i,j,k), you may move to positions of the form
(i-ℓ,j,k), (i+ℓ,j-ℓ,k), (0,j-ℓ,k), (i,j+ℓ,k-ℓ), (i+j+ℓ,0,k-ℓ)
and (0,0,k-ℓ)
with
i,j,k,ℓ all non negative integers, and all these triples must consist of non negative integers,
and ℓ > 0. This corresponds to the following possible bites in the game starting with
a (6,4,4) position, and ℓ can be changed by the sliders below:
(i-ℓ,j,k)
(i+ℓ,j-ℓ,k)
(0,j-ℓ,k)
(i,j+ℓ,k-ℓ)
(i+j+ℓ,0,k-ℓ)
(0,0,k-ℓ)
Playing chomp means taking bites out of the "chocolate bar".
On each move you take out a whole numnber of squares, by taking out
a square and all squares that are not below or left of it.
The bottom
left corner is bad, so you lose if you are forced to take that on your move.
So moving the sliders above give all possible moves for the above bar,
including taking all the bar, which is a loosing move.
Move ordering
These sliders show the moves are ordered, e.g., you could
move from A=(6,4,4) to C=(0,0,1) directly, but you could also move
from A to B = (0,1,4), for example. Chomp is an example of a
poset game. These are described in
Byrnes paper .
In a poset game the positions are ordered, and you can move to any smaller
position, e.g., if A > B > C, you can move from A to B or C.
Move type ordering
In order to compute whether something is winning, you need to consider all
intermediate moves. In this game, you can't make a type 6 move without
having the possibility of
first making a type 3 move. So there is an ordering on the move types,
type 1 → type 3 → type 6
type 2 → type 5
This is important for computational purposes.
How to use chart to win at Chomp
If you are playing a game of 3 row chomp, and want to know how to win... Suppose you are given
a position (i,j,k). Go to chart for value k. If (i,j,k) is marked by a blue dot, then...
it's not looking good.
If your point is not marked in blue, then
If it is to the right of a blue dot, then you just
move to that blue dot.
If it's on a grey line, then move to the blue dot on that gray line.
If it's on a red line, then you have to go to a smaller value of k and find the corresponding
position of the form (i,j+l,k-ℓ)
If it's on a blue line, you have to go to a smaller value of k and find the corresponding
position of the form (i+j+l,0,k-ℓ)
If you are at a position (i,j,k) and there is some position of the form (0,j-ℓ,k), then
move to that position.
Mouse over the positions will display the corresponding values in the diagram.
There may be more that one winning move, but for simplicty I
only show one
Note, there are six kinds of possible moves, but one of them is to a rectangle, which is never a
winning move to make (unless it leaves only the single bad square), so this lists only 5 possible cases.
References
I have linked to some references already above. There are many papers and pages on Chomp; here are the main ones I have been
refering to, in addition to the Friedman and Landsberg paper mentioned above, and various wikipeadia pages.